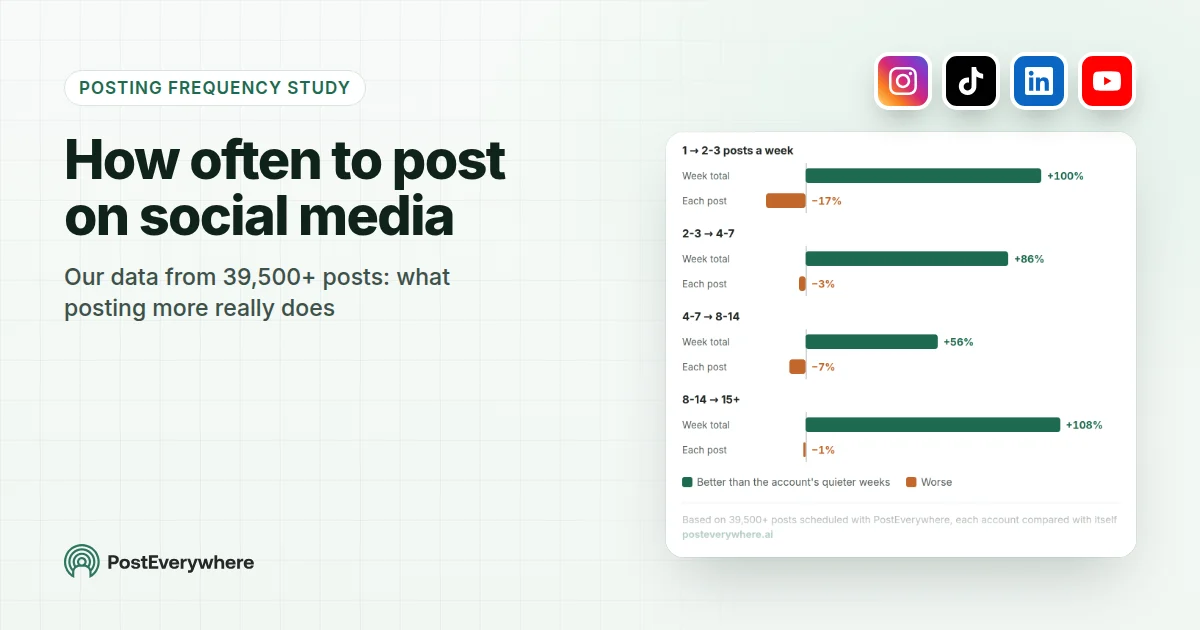
How often should you post on social media? As often as you can keep the quality up. In our data from more than 39,500 posts scheduled with PostEverywhere, when an account doubled its posts in a week, the week's total results roughly doubled too, while each post did only 1% to 7% worse than in that account's quieter weeks. For most accounts, 4 to 7 posts a week on each platform is a strong starting point, and Instagram, LinkedIn and YouTube held up well beyond that.
This guide is PostEverywhere's Posting Frequency Study 2026, an original data study built on our own data rather than other people's studies. Every number below comes from posts that real businesses, creators and agencies published through PostEverywhere.
We compared each account with itself, in its busier weeks and its quieter weeks, so a big account that posts a lot can't make high frequency look good on its own. The method is explained at the end.
Our findings at a glance
| Platform | What happened when the same account posted more | Good starting point |
|---|---|---|
| Each post did 1% to 8% worse per step; the week's total rose 43% to 100% | 4 to 7 posts a week, more if quality holds | |
| TikTok | Each video did 7% to 15% worse per step; the week's total still rose | 4 to 7 videos a week |
| 2-3 to 4-7 posts a week cost each post just 2% | 4 to 7 posts a week | |
| YouTube | Going from 1 to 2-3 uploads cost each video 32%; above that, no drop | 2 to 7 uploads a week, Shorts included |
| Not enough accounts in our data yet; see Facebook | 1 to 2 posts a day (Buffer) | |
| X (Twitter) | Not enough accounts in our data yet; see X (Twitter) | 3 to 4 posts a day (Buffer) |
| Threads | Not enough accounts in our data yet; see Threads | 3 to 4 a week, building to daily (Buffer) |
"Per step" means one step up our frequency ladder: 1, 2-3, 4-7, 8-14 and 15+ posts a week on that platform. Each step is roughly double the one before.
What happens when you post more often

| Posts a week (39,500+ posts) | Week's total results | Each post |
|---|---|---|
| 1 to 2-3 | +100% | -17% |
| 2-3 to 4-7 | +86% | -3% |
| 4-7 to 8-14 | +56% | -7% |
| 8-14 to 15+ | +108% | -1% |
The common worry is that posting more spreads your audience thin, so every post does worse and you gain nothing. Our data says the first half is true and the second half isn't.
- Each post did a little worse. Above 2-3 posts a week, each extra step cost each post between 1% and 7% compared with that account's usual post. The biggest drop came at the very bottom: going from one post a week to two or three cost each post 17%, though the week's total still doubled.
- The week did far better. The same accounts published about twice as many posts in their busier weeks, and the week's total results rose by 100%, 86%, 56% and 108% at the four steps. Between 69% and 85% of accounts saw their weekly total go up when they posted more.
- There was no cliff. Even at 15 or more posts a week on one platform, each post did only 1% worse than at 8 to 14.
So the trade is simple: each post gives up a little, and the week gains a lot. That holds as long as the extra posts are real posts, not filler.
Our data can't tell you what happens if you double your output by halving your effort.
More posts only help if they actually go out. PostEverywhere's posting queue lets you set your weekly openings once, then every post you add takes the next free opening. Start your 7-day free trial. Plans start at $9 a month.
Posting frequency by platform

| Each post (39,500+ posts) | 1 to 2-3 | 2-3 to 4-7 | 4-7 to 8-14 | 8-14 to 15+ |
|---|---|---|---|---|
| All platforms | -17% | -3% | -7% | -1% |
| -4% | -4% | -8% | -1% | |
| TikTok | too few accounts | -15% | -15% | -7% |
| -16% | -2% | -7% | +7% | |
| YouTube | -32% | +6% | +9% | 0% |
And here is what happened to the week's total results at each step, for the same accounts:
| Week's total results | 1 to 2-3 | 2-3 to 4-7 | 4-7 to 8-14 | 8-14 to 15+ |
|---|---|---|---|---|
| All platforms | +100% | +86% | +56% | +108% |
| +100% | +85% | +43% | +87% | |
| TikTok | too few accounts | +104% | +36% | too few accounts |
| +100% | +79% | +72% | +222% | |
| YouTube | +108% | +113% | +86% | +92% |
Instagram Posting Frequency
Our data from 14,000+ Instagram posts: post 4 to 7 times a week, and more if you can keep the quality up. Instagram was the most forgiving platform in our study.
Each step up cost each post between 1% and 8%, and the week's total engagement rose by 43% to 100% at every step.
Instagram posting frequency for growth
If you want your account to grow, the week's total is the number that matters, because it's the total amount of engagement your account earns. On that measure, more posts won at every step we could measure:
- 1 to 2-3 posts a week: each post did 4% worse; the week's total doubled.
- 2-3 to 4-7 a week: each post did 4% worse; the week's total rose 85%.
- 4-7 to 8-14 a week: each post did 8% worse; the week's total rose 43%. This is where the returns shrink most.
- 8-14 to 15+ a week: each post did 1% worse; the week's total rose 87%.
Our figures count feed posts, carousels and Reels together; Stories aren't included. Mixing formats is also how most accounts reach a higher cadence without running out of ideas. If you're deciding which format to add, see Instagram carousel best practices.
For when to post them, see the best time to post on Instagram, and for what Instagram ranks on, see how the Instagram algorithm works.
Schedule all of it from one place with the Instagram scheduler.
TikTok Posting Frequency
Our data from 4,500+ TikTok videos: post 4 to 7 videos a week. TikTok showed the clearest cost per video. Going from 2-3 to 4-7 videos a week cost each video 15% of its views, and so did going from 4-7 to 8-14. From 8-14 to 15+, each video did 7% worse.
The week's total views still went up: by 104% from 2-3 to 4-7 videos a week, and by 36% from 4-7 to 8-14. So posting more TikToks still brings more total views, but each extra video earns less than it would on Instagram or YouTube.
We didn't have enough accounts that post just once a week to call that step.
In practice, that makes 4 to 7 good videos a week the efficient zone for most accounts. Go higher when you have the ideas and editing time for it, not just to hit a number.
When to post them is covered in the best time to post on TikTok, and the ranking signals in how the TikTok algorithm works. Schedule videos with the TikTok scheduler.
LinkedIn Posting Frequency
Our data from 6,000+ LinkedIn posts: post 4 to 7 times a week. The step from 2-3 to 4-7 posts a week was almost free: each post did just 2% worse, and the week's total rose 79%.
- 1 to 2-3 a week: each post did 16% worse; the week's total doubled.
- 2-3 to 4-7 a week: each post did 2% worse; the week's total rose 79%.
- 4-7 to 8-14 a week: each post did 7% worse; the week's total rose 72%.
- 8-14 to 15+ a week: each post did 7% better, and the week's total more than tripled. Treat this as a sign that heavy posting doesn't backfire on LinkedIn, not as a target.
Document posts are a good way to add volume without writing more long text posts; draft them in AI Studio's LinkedIn Carousel format. See the best time to post on LinkedIn for when to post, and how the LinkedIn algorithm works for the feed itself.
Schedule posts for profiles and pages with the LinkedIn scheduler.
YouTube Posting Frequency
Our data from 9,500+ YouTube uploads: aim for 2 to 7 uploads a week, Shorts included. YouTube had the sharpest drop at the bottom and the flattest line after it.
Going from one upload a week to two or three cost each video 32% of its views, the biggest single drop in our study. The week's total views still more than doubled.
Above that, the extra uploads didn't hurt at all: each video did 6% better from 2-3 to 4-7 a week, 9% better from 4-7 to 8-14, and about the same from 8-14 to 15+.
The week's total rose by 86% to 113% at every step.
Our YouTube figures count long videos and Shorts together. Shorts are much quicker to make, so the practical reading is: keep your main videos at a pace you can make well, and use Shorts to add frequency.
For timing, see the best time to post on YouTube; for how recommendations work, see how the YouTube algorithm works. Schedule uploads with the YouTube scheduler.
PostEverywhere finds your best time to post, too. It learns from when your own posts do best and suggests those times as you schedule. Until your account has enough results, it shows what works on each platform across PostEverywhere. See your best times in PostEverywhere.
Facebook Posting Frequency
We don't yet have enough Facebook accounts posting at every frequency to publish our own figures, so here is the best outside guidance we found. Buffer's 2026 posting frequency guide recommends 1 to 2 posts a day for a Facebook Page.
Whatever number you choose, the pattern from the platforms we could measure is a useful guide: more posts brought more total results, at a small cost per post. See the best time to post on Facebook for timing, and schedule Page posts with the Facebook scheduler.
X (Twitter) Posting Frequency
Our data doesn't yet include enough X accounts at every frequency to publish figures. Buffer's 2026 posting frequency guide suggests 3 to 4 posts a day, spread out over the day.
See the best time to post on X and schedule posts and threads with the X scheduler.
Threads Posting Frequency
Threads is newer, and our data doesn't yet include enough Threads accounts at every frequency to publish figures. In its study of 2.5 million Threads posts, Buffer says consistency matters more than volume, that posting daily or more tends to go with stronger growth, and that if daily feels like too much, you should start with 3 to 4 posts a week and build from there.
See the best time to post on Threads for timing, and schedule posts with the Threads scheduler.
How to Build a Realistic Posting Schedule
The biggest mistake isn't posting too little. It's committing to a frequency you can't keep. A month of daily posts followed by two weeks of silence gives you the cost of posting more without the steady weekly total that made it worth it.
Step 1: Pick your main platforms
Put most of your effort into the 2 or 3 platforms where your audience is and where you get results. Our social media benchmarks tool helps you compare. Posting 4 to 7 times a week on three platforms beats posting once a week on eight.
Step 2: Set a cadence you can hold
Start at the "good starting point" from the table above, or one step below it if you're starting from scratch.
Step 3: Batch and schedule
Block two or three hours a week to create content, then schedule all of it in one go. This is the single most effective way to keep a cadence. Speed up the writing with AI Studio and use cross-posting tools to adapt one idea for several platforms.
Sample weekly schedule (3 platforms, about 4 to 5 posts each)
| Day | TikTok | ||
|---|---|---|---|
| Monday | Carousel | Text post | Video |
| Tuesday | Reel | Document post | - |
| Wednesday | Single image | Text post | Video |
| Thursday | Reel | Text post | Video |
| Friday | Carousel | - | Video |
| Saturday | - | - | - |
| Sunday | - | - | - |
That's 5 Instagram posts, 4 LinkedIn posts and 4 TikToks: 13 posts a week from one or two batching sessions. If customers find you on Google Maps, add a weekly Google Business Profile post to the same batch.
Plan it all in the content calendar, or use our free content calendar templates.
Let your AI agent fill the week. Ask Claude or ChatGPT to draft a week of posts for every platform and schedule them with PostEverywhere. Connect your AI agent.
When to Scale Up (and When to Scale Back)
Scale up when:
- Each post is holding its usual results as you add more (check your social media analytics)
- You have a batching and scheduling system that can take more volume without the quality dropping
- You have ideas left over each week, or a repurposing process that turns one piece into several posts
Scale back when:
- Each post is falling well below your usual results, by more than the small drops in our data
- You keep missing scheduled days
- Posts are getting visibly thinner: weaker hooks, generic visuals, shorter captions
Give it a few weeks
Hold a new cadence for at least a few weeks before you judge it. Single weeks swing a lot, and the comparison that matters is your busier weeks against your quieter ones, as in our study.
For more on staying steady, see 12 scheduling mistakes that kill engagement.
How we worked this out
- The posts: more than 39,500 posts published through PostEverywhere up to October 2026, with results read at least three days after they went out, from accounts with at least 15 such posts. PostEverywhere's own accounts are left out, and so are private, unlisted or "only me" uploads.
- The weeks: each account's posts were grouped into Monday-to-Sunday weeks in the poster's own time zone, then into five frequency levels: 1, 2-3, 4-7, 8-14 and 15+ posts a week on that platform.
- Each post: compared with the median of the same account's 20 nearest posts, using the same measure as our Best Time to Post Study 2026: engagement on Instagram, Facebook and Bluesky, views on TikTok and YouTube, impressions on Pinterest, and engagement or impressions on LinkedIn and X.
- The week: the total of that measure across all the account's posts that week, divided by the account's usual weekly total. Only weeks where every post had results count.
- Each account against itself: for every step up, we only used accounts with weeks at both levels and compared their busier weeks with their quieter ones. Every figure is the median across those accounts.
- The limits: we only report a figure with at least 20 accounts and 300 posts behind it. Accounts choose when to post more, often for a launch or a campaign, so a busy week can differ from a quiet one in more than its post count. Treat these as strong patterns, not guarantees.
How to cite this study: PostEverywhere, Posting Frequency Study 2026, based on 39,500+ posts scheduled with PostEverywhere, up to October 2026. https://posteverywhere.ai/blog/how-often-to-post-on-social-media
FAQs
How often should you post on social media?
As often as you can keep the quality up. In PostEverywhere's Posting Frequency Study 2026, from 39,500+ posts, doubling the posts in a week roughly doubled the week's total results while each post did only 1% to 7% worse (above 2-3 posts a week).
For most accounts, 4 to 7 posts a week on each main platform is a strong starting point.
Does posting more actually increase reach?
In our data, yes. When the same account roughly doubled its posts in a week, the week's total results rose by 56% to 108% at each step, and 69% to 85% of accounts saw their weekly total go up.
Each post did slightly worse, but not nearly enough to cancel out the extra posts.
How often should I post on Instagram to grow?
Our Instagram data from 14,000+ posts supports 4 to 7 posts a week, and more if you can keep quality up. Each step up in frequency cost each post 1% to 8%, while the week's total engagement rose 43% to 100%.
Mixing Reels, carousels and single images makes a higher cadence easier to sustain.
How many times a day should I post on TikTok?
Most accounts in our data did well at 4 to 7 videos a week, so roughly one a day. TikTok showed the biggest cost per video of any platform: each step up cost each video 7% to 15% of its views.
Total weekly views still went up, so post more when you have good videos to post, not just to fill slots.
How often should you post on LinkedIn?
4 to 7 times a week. In our LinkedIn data from 6,000+ posts, going from 2-3 to 4-7 posts a week cost each post just 2%, while the week's total rose 79%.
How often should you post on X (Twitter)?
Our data doesn't yet include enough X accounts at every frequency to publish figures. Buffer's 2026 posting frequency guide suggests 3 to 4 posts a day, spread out over the day.
Is it better to post 3 great posts or 7 okay posts a week?
Our data can't measure "great" or "okay", only how often accounts posted and how their posts did. What it does show is that each post did only slightly worse when the same account posted more, so if your extra posts are genuinely as good as your usual ones, more posts win.
If posting more means each post gets much worse, stay at the cadence you can do well.
How do I keep my posting frequency when I'm busy?
Batch your content and schedule it in advance. Set your weekly openings in the PostEverywhere queue and each new post takes the next free slot, or ask your AI agent to draft and schedule the week for you.
The Bottom Line
Posting more works, as long as the extra posts are real. In our data, doubling the posts in a week roughly doubled the week's total results, at a small cost to each post.
Start at 4 to 7 posts a week on your main platforms, hold it for a few weeks, and step up when the quality holds.
PostEverywhere makes a higher cadence sustainable: plan in the content calendar, fill the posting queue, publish at your best times, and keep it all running across your accounts with social media management tools built for teams and agencies.
A sustainable rate only matters if you can hold it: how to stay consistent on social media covers the systems side, and saving hours on social media the shortcuts that make it stick.
Sources
Every outside fact in this article comes from the pages below. Our own figures come from posts scheduled with PostEverywhere, as explained in How we worked this out.

Founder & CEO of PostEverywhere. Writing about social media strategy, publishing workflows, and analytics that help brands grow faster.